Tutorial 9: ISH-based STARmap dataset
Here we present our re-analysis of the ISH-based mouse visual cortex STARmap dataset (See Fig. S16 of the STAGATE paper for details).
The raw data are available at https://www.dropbox.com/sh/f7ebheru1lbz91s/AADm6D54GSEFXB1feRy6OSASa/visual_1020/20180505_BY3_1kgenes?dl=0&subfolder_nav_tracking=1.
The annotation information and the processed SCANPY object are provided at https://drive.google.com/drive/folders/1I1nxheWlc2RXSdiv24dex3YRaEh780my?usp=sharing.
Preparation
[1]:
import pandas as pd
import numpy as np
import scanpy as sc
import os
import sys
import matplotlib.pyplot as plt
import seaborn as sns
import gc
import warnings
warnings.filterwarnings("ignore")
[2]:
import STAGATE
[3]:
adata = sc.read('STARmap_20180505_BY3_1k.h5ad')
[4]:
adata.obs.head()
[4]:
| Total_counts | X | Y | label | |
|---|---|---|---|---|
| Cell_9 | 310 | 4980.777664 | -49.771247 | L6 |
| Cell_10 | 533 | 8729.177425 | -53.473114 | L4 |
| Cell_13 | 452 | 11547.566359 | -46.315493 | L2/3 |
| Cell_15 | 288 | 3280.980264 | -37.612811 | L6 |
| Cell_16 | 457 | 7582.793601 | -45.350312 | L4 |
[5]:
sc.pp.highly_variable_genes(adata, flavor="seurat_v3", n_top_genes=3000)
sc.pp.normalize_total(adata, target_sum=1e4)
sc.pp.log1p(adata)
Constructing the spatial network
[6]:
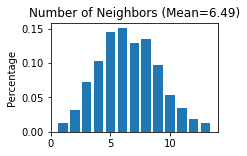
STAGATE.Cal_Spatial_Net(adata, rad_cutoff=400)
STAGATE.Stats_Spatial_Net(adata)
------Calculating spatial graph...
The graph contains 7838 edges, 1207 cells.
6.4938 neighbors per cell on average.
Running STAGATE
[7]:
adata = STAGATE.train_STAGATE(adata, alpha=0)
Size of Input:  (1207, 1020)
WARNING:tensorflow:From /home/dkn/anaconda3/envs/STAGATE_tf/lib/python3.6/site-packages/tensorflow_core/python/ops/math_grad.py:1375: where (from tensorflow.python.ops.array_ops) is deprecated and will be removed in a future version.
Instructions for updating:
Use tf.where in 2.0, which has the same broadcast rule as np.where
100%|██████████| 500/500 [00:21<00:00, 22.79it/s]
[8]:
sc.pp.neighbors(adata, use_rep='STAGATE')
sc.tl.umap(adata)
[9]:
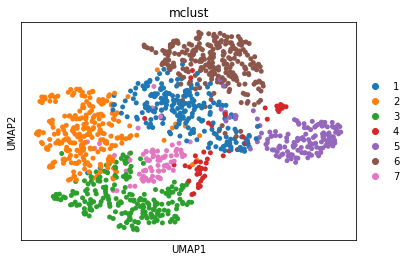
adata = STAGATE.mclust_R(adata, used_obsm='STAGATE', num_cluster=7)
R[write to console]:                    __           __
   ____ ___  _____/ /_  _______/ /_
  / __ `__ \/ ___/ / / / / ___/ __/
 / / / / / / /__/ / /_/ (__  ) /_
/_/ /_/ /_/\___/_/\__,_/____/\__/   version 5.4.10
Type 'citation("mclust")' for citing this R package in publications.
fitting ...
  |======================================================================| 100%
[ ]:
[10]:
sc.pl.umap(adata, color='mclust')
[11]:
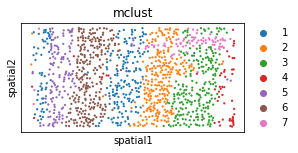
plt.rcParams["figure.figsize"] = (4, 2)
sc.pl.embedding(adata, basis="spatial", color='mclust', s=20, show=False)#, legend_loc=False)
[11]:
<AxesSubplot:title={'center':'mclust'}, xlabel='spatial1', ylabel='spatial2'>
[14]:
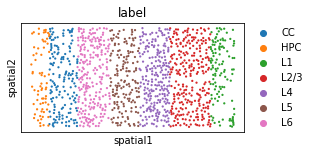
# layer annotation
plt.rcParams["figure.figsize"] = (4, 2)
sc.pl.embedding(adata, basis="spatial", color='label', s=20, show=False)#, legend_loc=False)
[14]:
<AxesSubplot:title={'center':'label'}, xlabel='spatial1', ylabel='spatial2'>
Calculate ARI
[15]:
from sklearn.metrics.cluster import adjusted_rand_score
[16]:
adjusted_rand_score(adata.obs['label'], adata.obs['mclust'])
[16]:
0.5441835384954468